Multimodal systems use several sensory systems (e.g. hearing and seeing). For physics lessons, this obtains a specific educational perspective: Physical phenomena and their theoretical description can be combined in a new way. The acoustic sensation and the physical description with graphs can be merged easily.
Overview (clickable map)
The following examples were created with AUDACITY.
Relationships between Amplitude and Volume, Frequency and Pitch
Between amplitude and volume, frequency and pitch "the-the-relationships" can be shown easily.
Tones of different volume
Tones of different frequency
2. Quantify Volumes
An appealing introduction can be playing the following two videos to analyze them subsequently.
The second video - in contrast to the first one - gives the impression that the sound become evenly louder.
However, this is at odds with the behavior of the amplitudes in the graph (at linear scale).
The apparent contradiction can only be resolved by the law of Weber and Fechner. Accordingly, the perception is proportional to the logarithm of the physical intensity.
Quantify Tones
The law of Weber and Fechner applies to the perception of volume and brightness, but also to the perception of pitches.
Sound example 1: Linear increase of frequency
-
Sound example 1: Tone sequence with intervals of 500 Hz (500 Hz, 1000 Hz, 1500 Hz, 2000Hz, 2500 Hz, 3500 Hz)
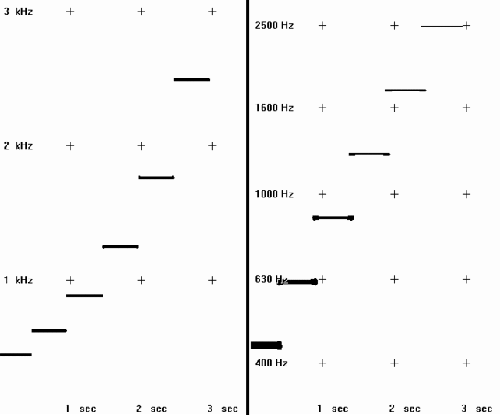
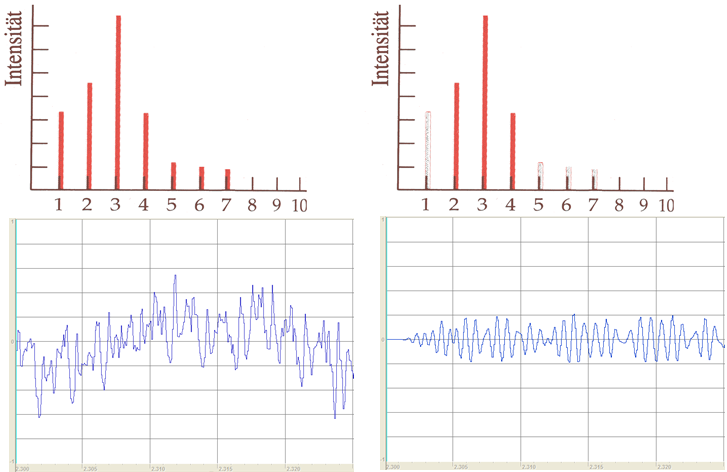
Sound example 2: Increase of frequencies by half an octave each, i.e. by three whole tone steps.
-
Sound example 2: a', dis', a'', dis'', a''', dis''', a''' (440 Hz, 622 Hz, 880 Hz, 1244.5 Hz, 1760 Hz, 2489 Hz, 3520 Hz)
Graph for sound example 2 with linear (left) and logarithmic scale (right):
Sound example3: C major scale sequence
-
Tone example3: 12 halftone steps in a row
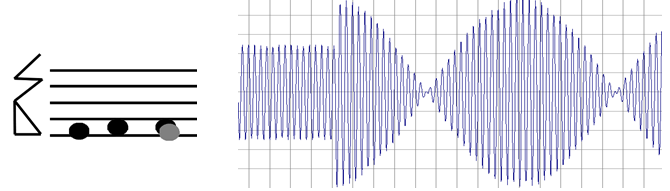
3. Classification of acoustic events
Sound can be classified according to characteristic forms of vibration.
Pure tone, sound/sonority, noise and bang/acoustic shock are different types.
Tone(sinusoidal tone)
|
Sound/sonority (flute)
|
Noise
|
Bang
|
To the top
4. Exercises
The following soundless video clips display the audio track of various sound events.
Chellenge: Have a look at these diagrams (video at the left) and predict what acoustic event it might represent.
Check: Start the solution video (right video - a multimodal application).
|
Example 1 |
Solution for example 1 |
|
Example 2 |
Solution for example 2 |
|
Example 3 |
Solution for example 3 |
|
Example 4 |
Solution for example 4 |
|
Example 5 |
Solution for example 5 |
To the top
5. Sound Experience
Tone richness / sonority
-
A "rich sonority” is perceived when several overtones resonate. The first example reduces sonority and applies a bandpass filter fading out high frequencies (> 2000 Hz) and low frequencies (800 Hz).
Superposition of acoustic signals
- Human ears can distinguish different sound sources surprisingly well. The next example addresses this ability:
- However, the distinction of tones becomes difficult when the frequencies differ only slightly. Two tones (from the c major scale) can still be distinguished with a good sense of hearing. But tones that differ only by half a half-tone step are no longer perceptible separately when played together. We then perceive the resulting beat as an unpleasant sound.
Temporal sequences
-
The distinction of tones and overtones is not that easy. They tend to be perceived as a unit. This is the starting point for a sound spiral (taken over by Werner Schneider), generating an impression that the tone is shifting to higher and higher and higher frequencies.
-
The succession in which undertones and overtones increase and decrease in their volume is also decisive for the sound perception. Piano tones played "backwards" sound like tones of a harmonium.
6. Experimenting with sound effects
Most computer programs for acoustic offer special sound effects. This allows students to quickly achieve impressive results. The following selection of examples can be created with AUDACITY (a free available program). Yet, these effects are also offered by other programs.
- An echo can be set up; intensity and time delay can be adjusted.
- A moving sound source can be simulated with stereo recordings. Simply the volume of one channel needs to be reduced continuously and simultaneously the volume on the other channel has to be increased.
- A continuous frequency shift combined with an increase in volume can be used to simulate a sound sources moving towards / away from a listener (Doppler Effect).
- Filters, e.g. high-pass or band-pass filters, can be used to mask voices ("Micki mouse voice") or to recreate the sound of an antiquated gramophone with "schellack records" (also with current music). The following example applies a band filter from 800 Hz to 2000 Hz.
- When piano sounds are played "backwards", this sounds like a harmonium.
To the top
Computer programs
Sound card, microphone and loudspeaker nowadays are part of the basic equipment of multimedia PCs. As a result, with the appropriate software a functionality is available that even goes beyond a frequency generator and a memory oscilloscope. Interactivity and the option for active learning reinforce the effects of a multimodal learning environment.
A recommended free program is: AUDACITY
In addition
- GOLDWAVE
- COOLEDIT
are useful.